
Observability
Observability runs Grafana with Prometheus, Mimir, Loki and Tempo on a host, already connected to each other. Every container’s logs, container and host metrics, and OpenTelemetry from your apps flow in by themselves, so you get dashboards, log search and traces without wiring anything up.
Observability is for administrators, because Grafana shows every container’s logs and metrics.
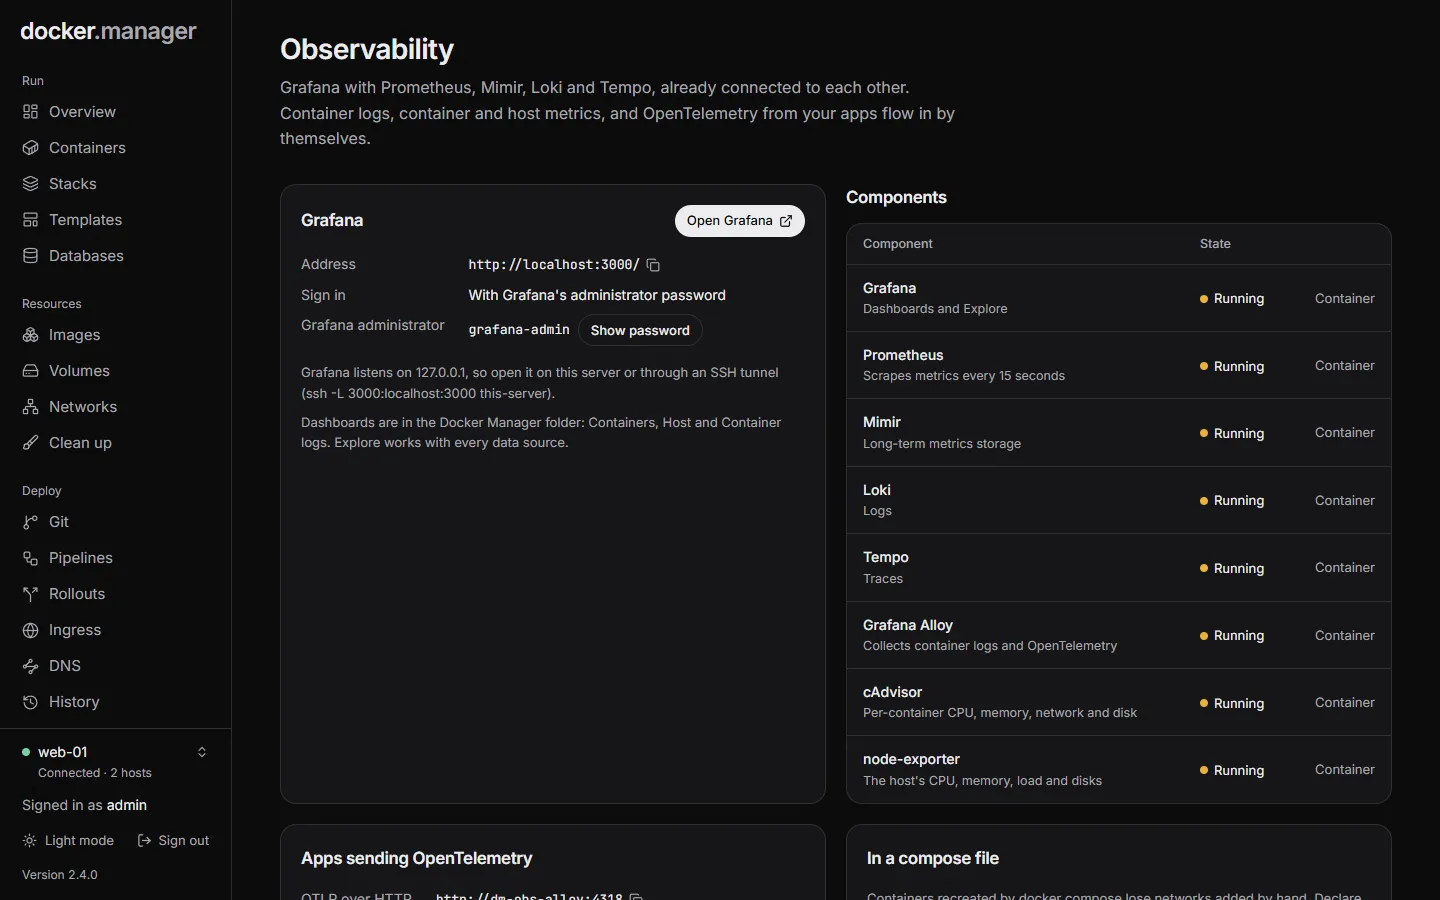
What’s in the stack
Section titled “What’s in the stack”One stack runs per host:
| Component | Image | Role |
|---|---|---|
| Grafana | grafana/grafana:13.3.1 |
Dashboards and Explore, with every data source set up |
| Prometheus | prom/prometheus:v3.16.0 |
Scrapes metrics every 15 seconds |
| Mimir | grafana/mimir:3.2.4 |
Long-term metrics: Prometheus writes everything into it (optional) |
| Loki | grafana/loki:3.7.9 |
Logs (optional) |
| Tempo | grafana/tempo:3.1.1 |
Traces, service graphs and span metrics (optional) |
| Grafana Alloy | grafana/alloy:v1.21.3 |
Collects container logs, and receives OpenTelemetry from apps |
| cAdvisor | ghcr.io/google/cadvisor:0.60.6 |
Per-container CPU, memory, network and disk |
| node-exporter | prom/node-exporter:v1.12.1 |
The host’s CPU, memory, load and disks |
Everything runs in containers named dm-obs-*, on their own network, with data in dm-obs-* volumes. Only Grafana
is reachable from outside. Each piece runs in single-server mode, which suits one host’s logs, metrics and traces
rather than a large fleet.
Start the stack
Section titled “Start the stack”Open Observability and choose:
Reach Grafana
- On a hostname, over HTTPS: through ingress, with a Let’s Encrypt certificate. Point the hostname’s DNS at this server first, and turn ingress on for the host. Administrators sign in with their Docker Manager account.
- On a port on this server: published on
127.0.0.1only. Sign in with Grafana’s own administrator password, shown on the page once it runs. Open it on the server, or through an SSH tunnel (ssh -L 3000:localhost:3000 your-server).
Components: Grafana and Prometheus are always on. Mimir keeps the long history (without it, Prometheus keeps it), Loki stores logs, and Tempo stores traces.
Collect
- Every container’s logs: Grafana Alloy reads them from Docker and labels them with the container and Compose service. Needs Loki.
- Container and host metrics: cAdvisor for each container’s CPU, memory, network and disk; node-exporter for the host.
- OpenTelemetry from your apps: apps you connect send traces, metrics and logs to Grafana Alloy, which passes them on.
Keep data for: days of metrics (30 by default), logs (14) and traces (7).
Press Start the stack. The first start downloads the images, about 4 GB on disk once unpacked, which can take a few minutes. The page updates by itself.
Using Grafana
Section titled “Using Grafana”Press Open Grafana. Grafana comes with three dashboards in a Docker Manager folder: Containers, Host and Container logs. Explore works with every data source. Trace ids in logs link to Tempo, and traces link back to their logs.
Signing in with a hostname. Docker Manager administrators sign in to Grafana with their own account. Docker Manager signs a short-lived token, the ingress proxy keeps it in a cookie and passes it to Grafana, and Grafana checks it with the public key Docker Manager gave it, so nothing else can sign anyone in. Other users can’t open Grafana.
Grafana’s own administrator account (Show password on the page) works on the port, or on the hostname at
/login?local, for when Docker Manager isn’t reachable.
Send data from your apps
Section titled “Send data from your apps”Apps that use the OpenTelemetry SDK can send traces, metrics and logs:
- Connect the container to the stack with Connect a container on the page. Connected containers reach Grafana
Alloy on the
dm-obs-otlpnetwork, and nothing else of the stack. - Point the SDK at
http://dm-obs-alloy:4318(HTTP), ordm-obs-alloy:4317for gRPC.
Alloy sends traces to Tempo, logs to Loki and metrics to Mimir (or Prometheus without Mimir).
Containers that docker compose re-creates lose networks added by hand, so for a stack, declare the network in its compose file instead. The page shows the lines to add, along these lines:
services:  app:    environment:      OTEL_EXPORTER_OTLP_ENDPOINT: http://dm-obs-alloy:4318      OTEL_SERVICE_NAME: my-app    networks: [default, dm-obs-otlp]
networks:  dm-obs-otlp:    external: true
Change or remove it
Section titled “Change or remove it”Components, collectors and retention can be changed at any time under Settings: press Apply changes, and only the containers whose settings change are recreated. Turning a component off keeps its data.
Remove stack removes the containers. The collected data is kept in its volumes unless you tick Also delete the collected data (which also deletes the dashboards you made in Grafana).
In the configuration file
Section titled “In the configuration file”The stack can be described under observability, keyed by host, in the
configuration file. See the
reference.